In early August, Kansas Department of Health and Environment Secretary Dr. Lee Norman doctored a chart to justify mask mandates, claiming the counties that adopted Governor Kelly’s order were “winning the battle.” It wasn’t true then, and it still isn’t true today.
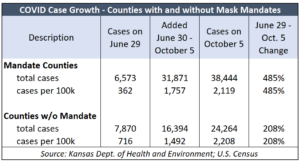
 According to KDHE, cases increased 485% between June 29 (a few days before 16 counties adopted Kelly’s mandate) and October 5, going from 6,573 to 38,444). The other 89 counties experienced a 208% increase (from 7,870 to 24,264).
Adjusting for population (mandate counties have about 1.8 million people vs. 1.1 million in the other counties) shows the counties with mandates added 1,757 cases per 100,000 of population, or 18% more than the 1,492 added in counties without mandates.
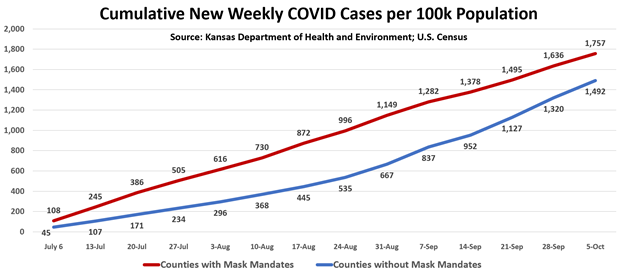
The chart below tracks the growth on a cumulative basis, showing the gap grew progressively wider through the end of August as cases grew much faster in the mandate counties, and then closing the gap a little in September. For example, between June 29 and July 6, the mandate counties added 108 cases per 100,000 of population; 137 more were added the following week, bringing the 2-week cumulative total to 245. By comparison, the counties without mandates added 45 cases per 100,000 population the first week and 62 more the next week, for a 2-week total of 107.

Some health officials and school board members insist that mask mandates are necessary to allow kids to return to school and for customers to patronize local businesses, but the data from KDHE refutes their belief.
Sedgwick County Health Department Director Adrienne Byrne said in an email to the Sentinel, “SC [Sedgwick County) recovery metrics, looking at weekly trends, clearly shows the orders, including masks, are very effective.”
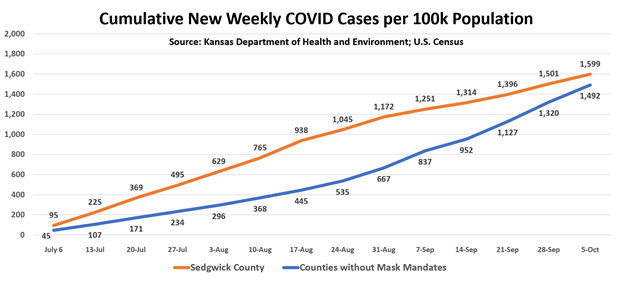
Except it doesn’t. Sedgwick County went from 892 cases on June 29 to 9,509 on October 5; that’s a 655% increase compared to 208% for the counties without a mandate. On a per-100k basis, Sedgwick County added 1,599 cases…which is more than the 1,492 added by counties without mandates.

The gap is narrowed in September but health officials have said it only takes up to 2 weeks for a mandate to begin showing effect, not 8 weeks; crediting the mandate with closing the gap in September also ignores the fact that cases grew much faster in Sedgwick county in July and August.
But Dr. Byrne at least responded. The Sentinel also asked KDHE, the county health directors in Johnson and Wyandotte counties, and Wichita mayor Brandon Whipple for comment, as well as the school superintendents of Shawnee Mission, Olathe, Blue Valley, and Wichita; none of them responded.
Mask mandates ? lower cases worldwide
Kansas isn’t the only example of high mask use not translating to lower case spread.
According to an article published by the Council on Foreign Relations, 93% of Singapore residents said they wore a mask in public when surveyed in July (in compliance with a national mask mandate) and there were 7,825.7 COVID cases per million of population as of July 12. But only 3% of Norway residents said they always were a mask outdoors and there were just 1,653.7 cases per million. Finland had even lower levels, with 1% mask usage and only 1,315.7 cases per million
Consequences low in most cases
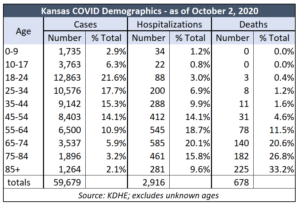
A new chart posted Kansas Policy Institute’s COVID Information Center shows low levels of hospitalization and death due to COVID-19.
 Through October 2, only 2% of the roughly 5,500 cases for kids aged 0-17 required hospitalization and there have been no deaths reported. Young adults aged 18-54 also have relatively low consequences; only 988 of the nearly 41,000 cases required hospitalization (just 2.4%) and there have been 53 deaths for a 0.1% mortality rate (or a 99.9% survival rate).
Outcomes are worse, unfortunately, for Adults 75+. They account for only about 5% of cases (3,160) but a quarter of the hospitalizations and more than half the deaths.
Other charts and tables in the COVID Information Center include:
- Comparative trends – cases, hospitalizations, and deaths for the State of Kansas, Johnson County, Wyandotte County, and Kansas City, Missouri
- Cases, deaths, mortality rate, and infection rate by county
- Hospital beds available in Kansas and regional states
- Cases and deaths by state
- Pneumonia, COVID, and flu deaths
- COVID economic impact


