

The hiring of non-teachers (administrators and all other employees who are not teachers) has continued an upward trend in Kansas for the past decade in spite of enrollment declines in many districts.
As this table indicates, districts with declining enrollments (FTE = full-time equivalent students) since 2015 have nevertheless seen an increase in employment away from the classroom, and even those with student numbers on the rise appear to be on a hiring binge for non-teachers.

With obvious budgetary implications as more funding is drawn away from the classroom, we asked ten superintendents to comment on the effect their decisions have on declining student achievement in the state. USD 265 Goddard Superintendent Justin Henry said he “doesn’t have the expertise” to respond and said his assistant superintendent for HR would reply, but that did not happen.
The superintendents from Independence, Maize, Hays, Baldwin City, and Goodland did not answer our questions.
Achievement declines while employment of non-teachers soars
The four superintendents who responded commented on their employment changes, but they didn’t address how their decisions impacted student outcomes, which has declined in every case since 2015.
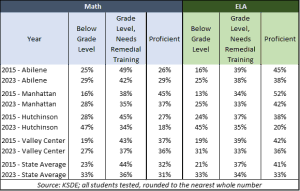 Abilene held steady in math, but English language arts declined as proficiency fell from 45% to 38%, and the portion of students below grade level increased to 25%.
Math proficiency in Manhattan dropped from 45% to 37% fell to 42%; the percentage of students below grade level increased significantly for both subjects.
Hutchinson’s outcomes precipitously declined in both subjects. Math proficiency fell from 27% to 18%, and ELA plummeted from 38% to 20%, while the number of students below grade level rose to nearly 50%.
Proficiency fell less dramatically in Valley Center but the percentage below grade level jumped from 19% in both subjects to 27% in math and 31% in ELA.
Dr. Dawn Johnson, Superintendent of USD 308 in Hutchinson, says, “USD 308 believes in using data to make budget decisions and uses sound budgeting practices to be good stewards of the public funds. If necessary, responsible adjustments are made to address reduced revenues with the least impact to students. USD 308 believes in hiring quality staff to meet the needs of our diverse learners.”
The data doesn’t support Johnson’s statement, however. Hutchinson reduced classroom teachers — the employees who have the most impact on students — by 11%, and non-teachers increased by 22%.
Valley Center Superintendent Greg Lehr wrote, “In USD 262, we used to be a part of interlocal, and now we are the host district of the Ark Valley Special Education Cooperative. This resulted in us adding many employees who were not a part of our district previously.”
Lehr’s statement checks out, as most of the increase in non-teaching positions is in paras and other special education positions.
Superintendent Greg Brown of USD 435 says, “Abilene has reduced teaching positions keeping in step with declining enrollment. I have just completed my fifth year as superintendent of Abilene Schools. During the past four years, we established a 4-year-old preschool program which has grown from two full-day sections to four. This has obviously required our district to hire four teachers and four classroom aides (classified employee positions). Even with the addition of these four teachers, we have decreased our teaching staff approximately 5% as enrollment has decreased. As teachers have entered retirement and changed career directions, we have been able to accomplish this reduction in staff through attrition.
The Abilene employment data, however, shows that classroom teacher employment has held steady while enrollment fell by 13% and hiring of non-teachers jumped 38%. Brown attributed some of the additional non-teachers to using one-time federal funds to hire student support positions
Brown also made an inaccurate statement about school funding.
“Although I know the KPI has been critical of the Gannon decision, I believe it is important to point out how the funding law developed by the Kansas Supreme Court has provided declining enrollment districts an opportunity to maintain the ideal that ALL students in Kansas deserve a quality educational experience regardless of their zip code.”
The Sentinel’s parent company, Kansas Policy Institute, certainly criticized the legal arguments and the many other facts presented in Gannon, but the court did not provide any extra funding to districts with declining enrollment. The Legislature voluntarily modified the school funding formula to delay funding impact related to enrollment declines.
Kansas Policy Institute CEO Dave Trabert says it is ironic that Brown raises the issue of all students having the opportunity to a quality education since school districts vehemently oppose legislation to provide such opportunities and ignore a state law designed to improve outcomes.
“Low-income students are more than twice as likely to be below grade level in math than their more affluent classmates (20% vs. 46%), and students who are not low-income are almost three times more likely to be proficient (44% vs. 18%). Legislators know that school districts, the state school board association, and teacher unions will get them tossed out of office if they support school choice for low-income students, and the education system won’t use funding that’s targeted to help students at risk of failing as required by state law. The Legislature provides more than $500 million annually in at-risk funding, but two state audits have found that districts are not spending the money on extra services for at-risk students as required by state law.”
Special Education Funding excuse doesn’t hold water
School funding is significantly higher than in 2015. Spending is approaching $18,000 per student, and total aid from state and local taxpayers increased by more than $1.5 billion, but school districts wanted a lot more, and they are trying to get it through Special Education.
Governor Kelly wants to increase special education funding by $1 billion over several years, but the Legislature added $75 million recently. The arguments over whether funding is less than required or even needed go deep into the weeds, and USD 383 Manhattan Superintend Eric Reed referenced the issue in his reply.
“With the excess cost we receive (for special education) from the state being drastically less than what should be provided by statute, we have had a lot of pressure on our budget to meet the needs of our students with disabilities. Those non-classroom positions assist student achievement in supporting students with their disabilities whether through speech, OT (Occupational Therapy), PT (Physical Therapy), social work, academic classroom work, and/or medical services. With the federal requirement to meet the needs of an IEP (Individualized Education Program), the shortage of funding on excess costs of special education are the most concerning to our budget. Several positions that contributed toward increasing non-classroom staff are intentional in response to academic needs. We have expanded staffing of reading and math intervention support considered non-classroom work actively to improve student achievement while others are just due to increasing enrollment.”
 Data from the Kansas Department of Education show a 14% increase in full-time equivalent enrollment in Manhattan between 2015 and 2024. That includes 2% more special education students, but a 15% decline in special education teachers and a small reduction in special education directors seems to indicate that the service demand is not much different. The district did, however, add about 130 more special education paras.
Other data show the district has been able to significantly increase employment in other areas, including managers (32%), maintenance staff (39%), and clerical staff (43%).
The increase in Manhattan’s carryover cash reserves also indicates that funding has not been inadequate. Cash reserve balances function like personal checkbooks; having higher balances over time means the district took in more revenue than it spent. Special Education reserves were about $600,000 higher in 2023, and all other operating cash reserves increased by about $18 million. Cash reserve balances for 2024 are not yet published.
Reed also said, “Prior to the legislature providing adequate and equitable funding on a consistent basis, our district made many reductions to non-classroom teaching positions. This was felt by our staff and families and as we have received feedback through the needs assessment process, and our buildings and families have advocated for providing more adequate student support staff to meet the needs of our students and provide a safe environment.
Some positions may have been reduced, but the data refute Reed’s claim overall. In 2005, USD 383 had 370 non-teachers, not counting those dedicated to special education. By 2010, the total had increased to 511, and there were 516 in 2023. While districts hired more non-teachers, student outcomes declined.
Trabert says education officials undoubtedly want outcomes to improve, but they seem unwilling to change their behaviors to make it happen.
“Once again, analysis of education spending practices demonstrates a significant disconnect from actions needed to improve student outcomes. We’re sure that everyone believes they doing the right things, but outcomes remain stubbornly low. No one is to blame for low achievement, but everyone is responsible for identifying the substantive changes that are needed to get students the education they deserve.”