A guest columnist for the Kansas Reflector wants you to believe that the public school bureaucracy is producing high achievement, not unlike a magician wants you to believe that a person can be sawn in half and reassembled in the blink of an eye.
Columnist J.C. Moore cites a series of rankings to give the impression that Kansas public schools have high achievement, but he doesn’t disclose that those rankings have little to do with student achievement. It’s an illusion of which David Copperfield would be proud.
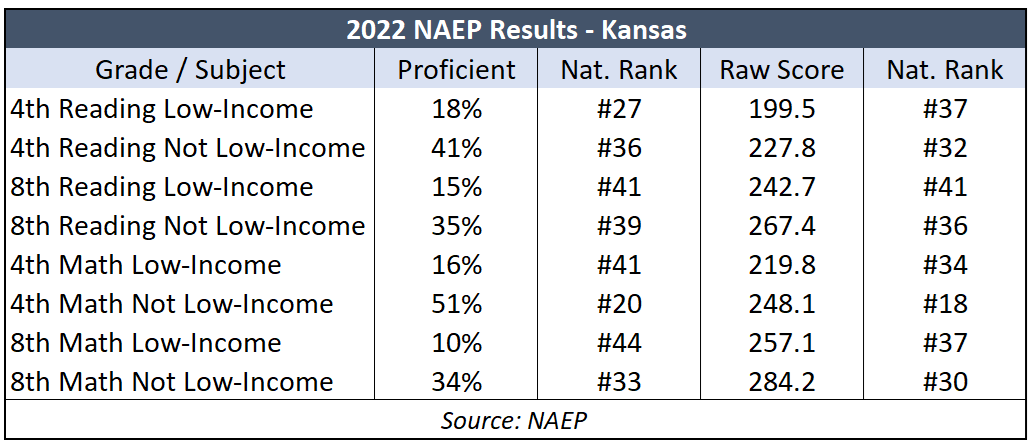
Here is the harsh reality that Moore and the education establishment want to be hidden from public view: Kansas ranks below average in a nation that doesn’t perform well. On the Nation’s Report Card (NAEP, USDE), rankings range from #20 to #44. And even ‘good’ rankings can be very deceptive. For example, the state’s ranking of #27 for 4th Grade Reading among low-income students may sound OK, but only 18% of those students can read proficiently, and that is definitely not good.

ACT results on the demographic comparisons each have Kansas in the mid-30s; Overall, only 21% of graduates who took the 2022 ACT were college-ready in English, Reading, Math, and Science.
The 2022 state assessment, given to all students in Grades 3-8 and 10, shows more students below grade level in reading and math than are proficient.
In short, few parents (if any) would describe the student achievement data as reflective of a system that is producing acceptable outcomes. And that’s why Moore’s defense of the education establishment cannot speak of actual achievement and must resort on flimflam.
Moore references a report from the Kansas Association of School Boards (KASB) which falsely implies that Kansas is among the ten best states in the nation. The proprietary method employed by KASB has been debunked many times for basing two-thirds of their criteria on things that do not measure academic achievement, and some of the achievement data they use is counted twice. KASB tortures the truth to make people believe that the only states that purportedly have better achievement happen to spend a lot more per student – yet another KASB claim that is not true.
An analysis of the 2022 NAEP scores[i] comparing the most recent spending per student adjusted for the cost of living finds ten states with the same score but a wide spending range. Utah spent the least at $10,866 per student, and New York spent the most of those ten states at $20,827 per student.
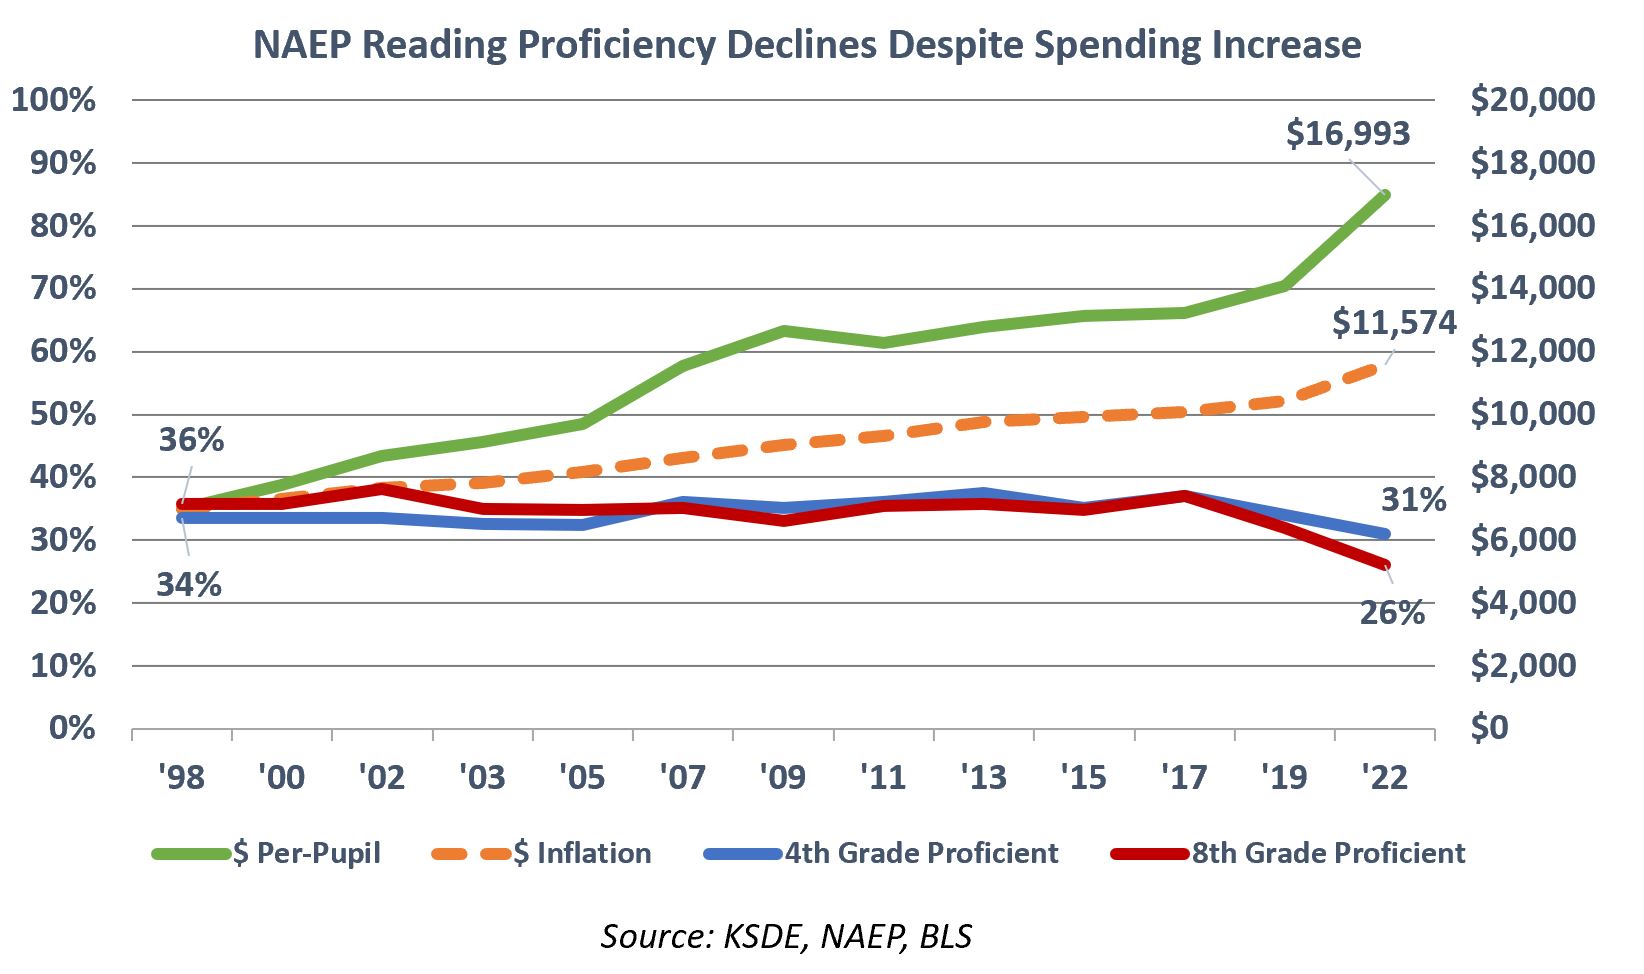
Tracking Kansas NAEP scores over time also shows no causation between spending and achievement. Spending per student increased much faster than inflation between 1998 and 2022, but reading proficiency declined.

Next, Moore cites something published in Forbes by Renee Morad, a freelance personal finance writer. Morad does not provide the methodology or any explanation. Rankings for ‘quality’ and ‘safety’ are listed, but she says nothing about educational outcomes and writes only about the business climate in each state.
Moore’s final piece of ‘evidence’ cites a ranking by the Network for Public Schools, which exists to promote public education and bash everything else. The title of their report (not shared by Moore) is telling – Measuring Each State’s Commitment to Democratically Governed Schools. Basically, states that are the most hostile to school choice get the highest rankings, so it is no surprise that it ranked Kansas #10.
NPE lists five scoring criteria, but academic achievement is not among them.
All the data – NAEP, ACT, and the state assessment – point to relatively low outcomes for most students in Kansas, and the results are getting worse. The only question is whether J.C. Moore read the studies he cited and consciously misled readers or simply regurgitated something he’d been told without doing research.
[i] An 8-score composite equally weighted; reading and math for 4th-grade and 8th-grade students who are low-income and those who are not low-income (two subjects, two grades, and two demographics).


