A statistical analysis of COVID testing and cases by Kansas Policy Institute shows one positive case for roughly every ten tests conducted, ranking Kansas #26 among the states and the District of Columbia. Michael Austin, director of KPI’s Center for Entrepreneurial Government, performed the analysis and says this is good news for Kansans.
“The reason Kansas is more than 70% below the national average in COVID-19 cases per capita isn’t primarily due to low testing, but the fact Kansas’s low population density and other factors don’t put it on the level as Coastal states. Kansas is employing tests per positive case at the same rate as known infectious states like California and Washington. More testing is a good thing, but it shouldn’t be a requirement to reopening the economy.”
 As of yesterday, Worldometers.info reports Kansas has conducted 18,130 COVID tests, which is 6,223 tests per million of population from the 2019 U.S. Census estimate. That ranks Kansas #51 among the states and the District of Columbia and prompted concern that that could mean cases per million could be much higher.
But Austin says the data suggests COVID testing levels aren’t the driving factor. Twelve states have higher testing levels than Kansas and also have fewer cases per million.
Alaska, for example, proportionally tested more double Kansas’ rate (13,526 per million) but has fewer cases per million (436 vs 635 for Kansas). Hawaii has tested 17,270 per million but also found fewer cases per million than Kansas – just 410.
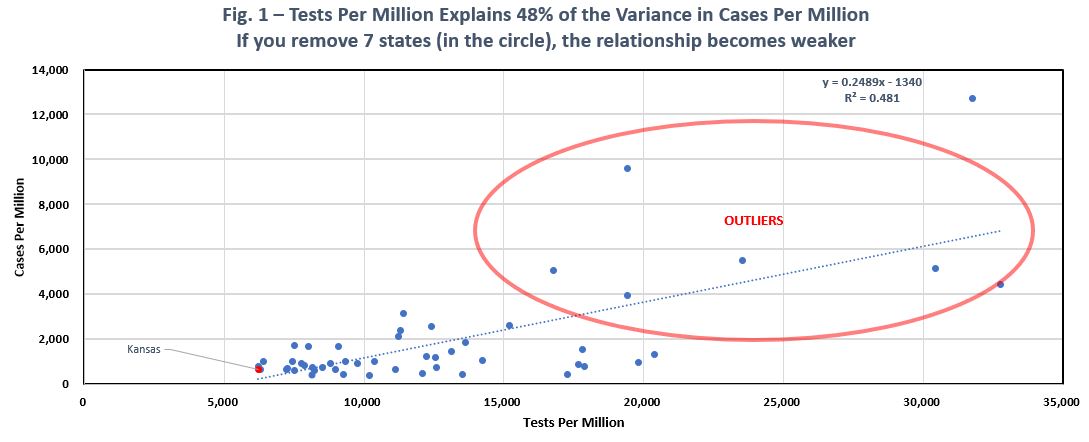
Another 13 states have a smaller ratio of cases-to-tests than Kansas, as shown on Figure 1 below.
Kansas is reflected by the red dot. Austin says the linear progression in Figure 1 isn’t very strong. With just 50% of the variance in the change in cases per million being attributable to the number of tests per million, this means there are other factors that should be considered to better predict cases per million of states.

“The dotted line is the line of best fit to the data, or the relationship between cases per million and tests per million. The flatter the line is, the weaker the relationship between tests and cases. What’s interesting to note however, is the vast majority of states have less than 4,000 cases, while varying wildly in tests. The line of best fit is heavily influenced by the 7 or so outlier states in the red circle. If these states were removed, the dotted line would pivot to a far flatter slope, suggesting the true relationship (R2) between tests and cases is far weaker than this preliminary analysis suggests.”
Austin’s Figure removes the seven outliers – New Jersey, New York, Louisiana, Rhode Island, Massachusetts, Connecticut, and the District of Columbia. The slope of the line is much flatter and the R2 factor drops from 48 to 4, meaning testing accounts for just 4% of the variance in cases per million.

Kansas Policy Institute is the Sentinel’s parent company.

