

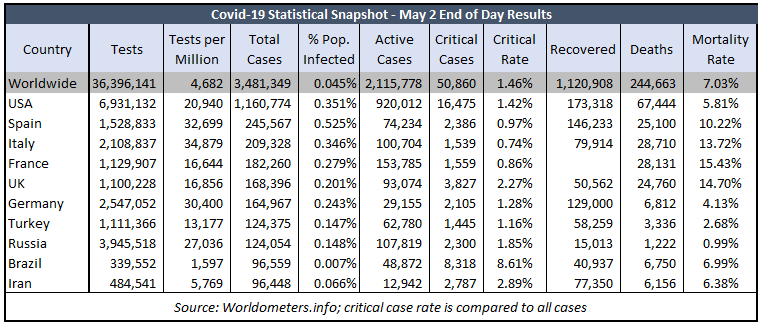
Update May 3 at 9:00 am: Final results for May 2
- Kansas has 1,591 cases per million of population vs. the national average of 3,466.
- Kansas has 48 deaths per million of population vs. the national average of 203.
- Missouri has 1,357 cases per million and 61 deaths per million.
- The national mortality rate is 5.81% and the world rate is 7.03%.

__________________________________________________________________
Update May 2 at 9:00 am: Final results for May 1
- Kansas has 1,557 cases per million of population vs. the national average of 3,377.
- Kansas has 47 deaths per million of population vs. the national average of 198.
- Missouri has 1,306 cases per million and 58 deaths per million.
- The national mortality rate is 5.81% and the world rate is 7.05%.


__________________________________________________________________
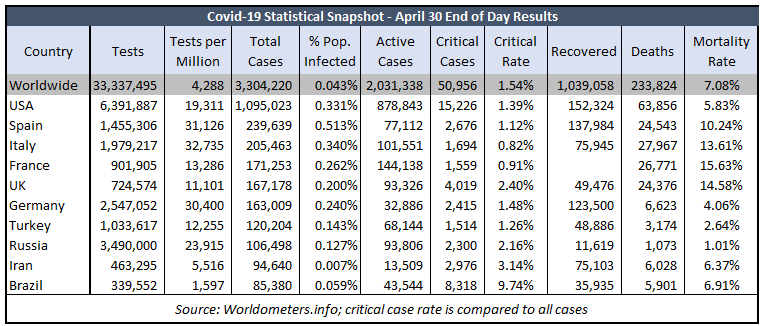
Update May 1 at 10:30 am: Final results for April 30
- Kansas has 1,477 cases per million of population vs. the national average of 3,271.
- Kansas has 46 deaths per million of population vs. the national average of 192.
- Missouri has 1,265 cases per million and 56 deaths per million.
- The national mortality rate is 5.83% and the world rate is 7.08%.

__________________________________________________________________
Update April 30 at 10:30 am: Final results for April 29
- Kansas has 1,318 cases per million of population vs. the national average of 3,180.
- Kansas has 46 deaths per million of population vs. the national average of 186.
- Missouri has 1,234 cases per million and 55 deaths per million.
- The national mortality rate is 5.79% and the world rate is 7.09%.


__________________________________________________________________
Update April 29 at 10:00 am: Final results for April 28
- Kansas has 1,228 cases per million of population vs. the national average of 3,097.
- Kansas has 44 deaths per million of population vs. the national average of 178.
- Missouri has 1,202 cases per million and 53 deaths per million.
- The national mortality rate is 5.72% and the world rate is 6.90%.


__________________________________________________________________
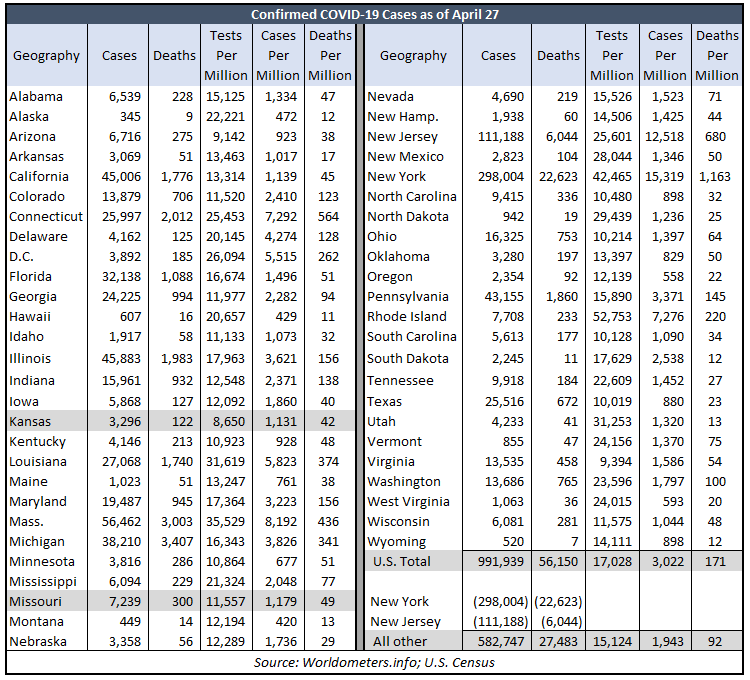
Update April 28 at 10:15 am: Final results for April 27
- Kansas has 1,131 cases per million of population vs. the national average of 3,022.
- Kansas has 42 deaths per million of population vs. the national average of 171.
- Missouri has 1,179 cases per million and 49 deaths per million.
- The national mortality rate is 5.62% and the world rate is 6.90%.

__________________________________________________________________
Update April 27 at 9:30 am: Final results for April 26
- Kansas has 1,089 cases per million of population vs. the national average of 2,954.
- Kansas has 41 deaths per million of population vs. the national average of 167.
- Missouri has 1,145 cases per million and 46 deaths per million.
- The national mortality rate is 5.61% and the world rate is 6.91%.


__________________________________________________________________
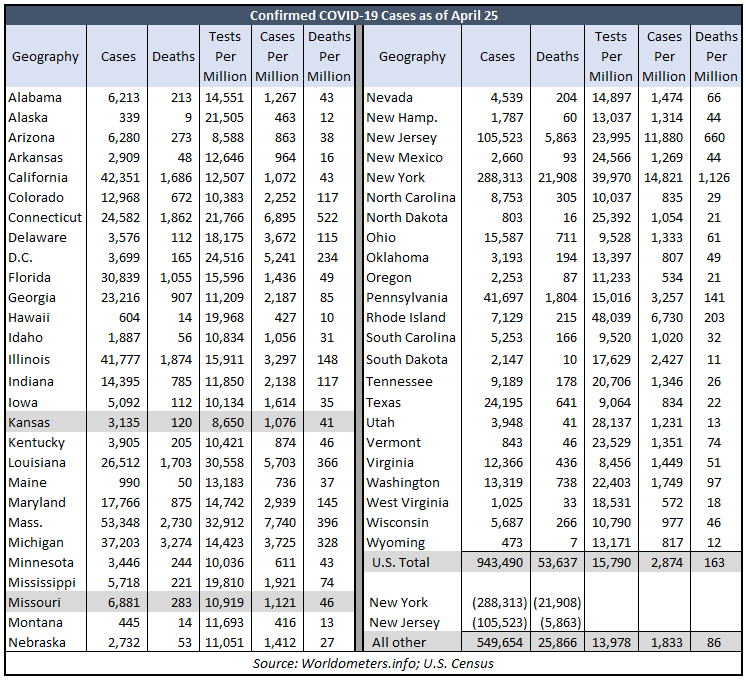
Update April 26 at 10:30 am: Final results for April 25
- Kansas has 1,076 cases per million of population vs. the national average of 2,874.
- Kansas has 41 deaths per million of population vs. the national average of 163.
- Missouri has 1,121 cases per million and 46 deaths per million.
- The national mortality rate is 5.65% and the world rate is 6.96%.

__________________________________________________________________
Update April 25 at 9:00 am: Final results for April 24
- Kansas has 1,014 cases per million of population vs. the national average of 2,767.
- Kansas has 41 deaths per million of population vs. the national average of 157.
- Missouri has 1,091 cases per million and 44 deaths per million.
- The national mortality rate is 5.64% and the world rate is 6.97%.


__________________________________________________________________
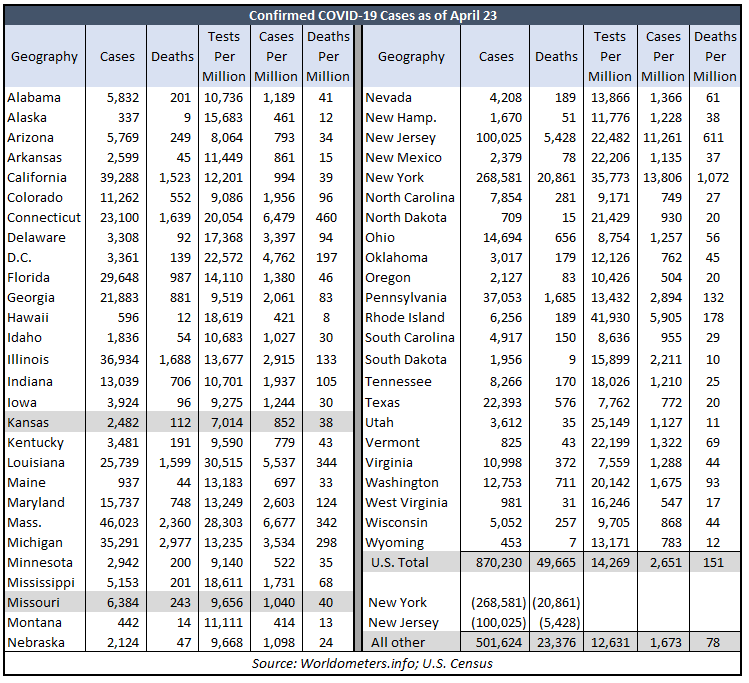
Update April 24 at 9:00 am: Final results for April 23
- Kansas has 852 cases per million of population vs. the national average of 2,651.
- Kansas has 38 deaths per million of population vs. the national average of 151.
- Missouri has 1,040 cases per million and 40 deaths per million.
- The national mortality rate is 5.67% and the world rate is 7.01%.

__________________________________________________________________
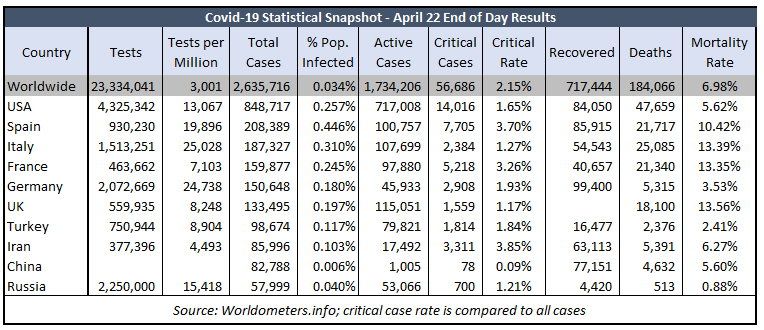
Update April 23 at 8:45 am: Final results for April 22
- Kansas has 795 cases per million of population vs. the national average of 2,556.
- Kansas has 38 deaths per million of population vs. the national average of 145.
- Missouri has 1,008 cases per million and 38 deaths per million.
- The national mortality rate is 5.62% and the world rate is 6.98%.

__________________________________________________________________
Update April 22 at 8:45 am: Final results for April 21
- Kansas has 759 cases per million of population vs. the national average of 2,466.
- Kansas has 37 deaths per million of population vs. the national average of 138.
- Missouri has 968 cases per million and 36 deaths per million.
- The national mortality rate is 5.54% and the world rate is 6.94%.


__________________________________________________________________
Update April 21 at 8:30 am: Final results for April 20
- Kansas has 682 cases per million of population vs. the national average of 2,388.
- Kansas has 34 deaths per million of population vs. the national average of 129.
- Missouri has 950 cases per million and 33 deaths per million.
- The national mortality rate is 5.36% and the world rate is 6.87%.


__________________________________________________________________
Update April 20 at 8:30 am: Final results for April 19
- Kansas has 635 cases per million of population vs. the national average of 2,304.
- Kansas has 32 deaths per million of population vs. the national average of 123.
- Missouri has 928 cases per million and 32 deaths per million.
- The national mortality rate is 5.31% and the world rate is 6.86%.


__________________________________________________________________
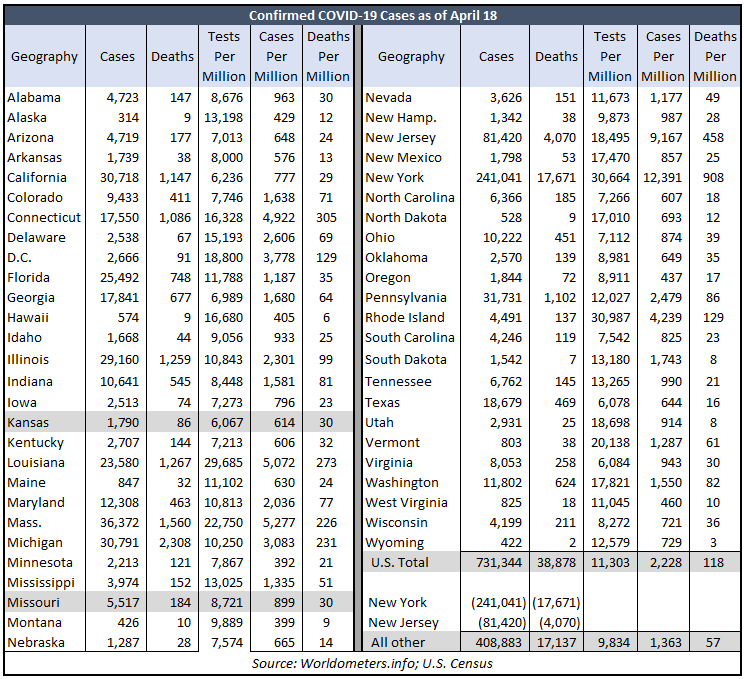
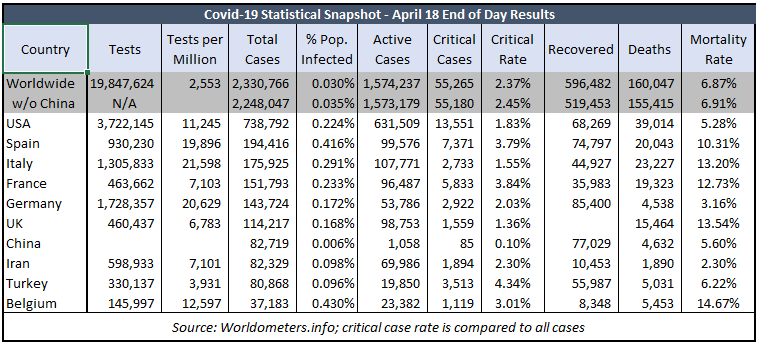
Update April 19 at 9:15 am: Final results for April 18
- Kansas has 614 cases per million of population vs. the national average of 2,228.
- Kansas has 30 deaths per million of population vs. the national average of 118.
- Missouri has 899 cases per million and 30 deaths per million.
- The national mortality rate is 5.28% and the world rate is 6.87%.
__________________________________________________________________
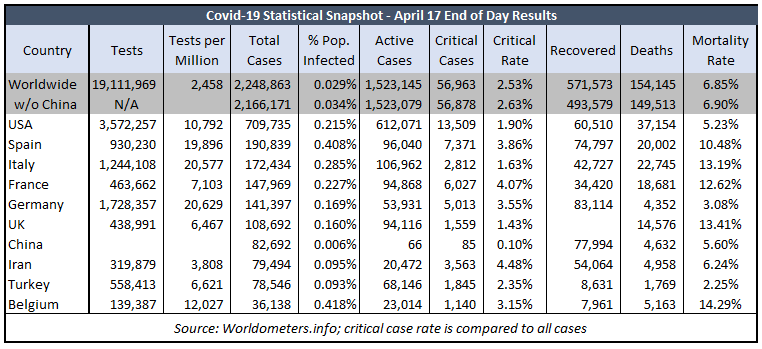
Update April 18 at 9:15 am: Final results for April 17
- Kansas has 585 cases per million of population vs. the national average of 2,140.
- Kansas has 29 deaths per million of population vs. the national average of 113.
- Missouri has 861 cases per million and 30 deaths per million.
- The national mortality rate is 5.23% and the world rate is 6.85%.

__________________________________________________________________
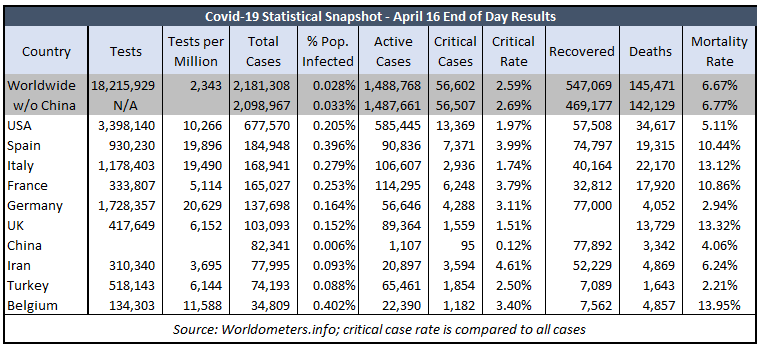
Update April 17 at 8:30 am: Final results for April 16
Note: Worldometers added 3,914 deaths to New York’s previous day total for April 15, but didn’t explain when the variance occurred in the past.
- Kansas has 550 cases per million of population vs. the national average of 2,043.
- Kansas has 27 deaths per million of population vs. the national average of 105.
- Missouri has 844 cases per million and 27 deaths per million.
- The national mortality rate is 5.11% and the world rate is 6.67%.

__________________________________________________________________
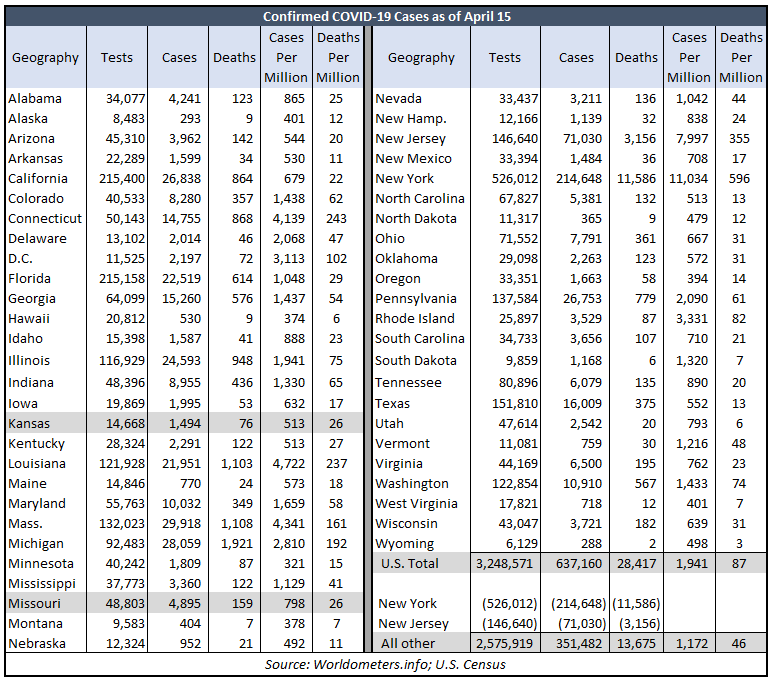
Update April 16 at 8:30 am: Final results for April 15
- Kansas has 513 cases per million of population vs. the national average of 1,941.
- Kansas has 26 deaths per million of population vs. the national average of 87.
- Missouri has 798 cases per million and 26 deaths per million.
- The national mortality rate is 4.43% and the world rate is 6.46%.

__________________________________________________________________
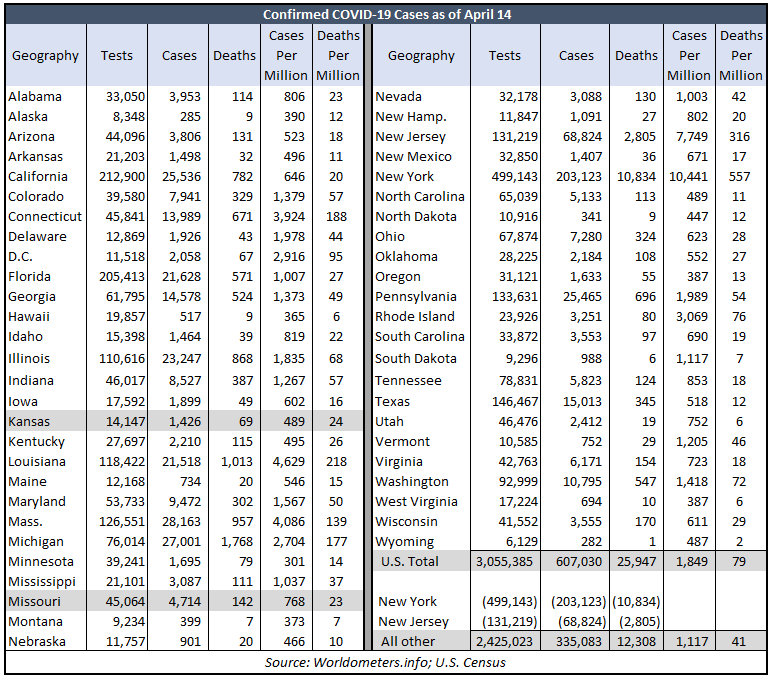
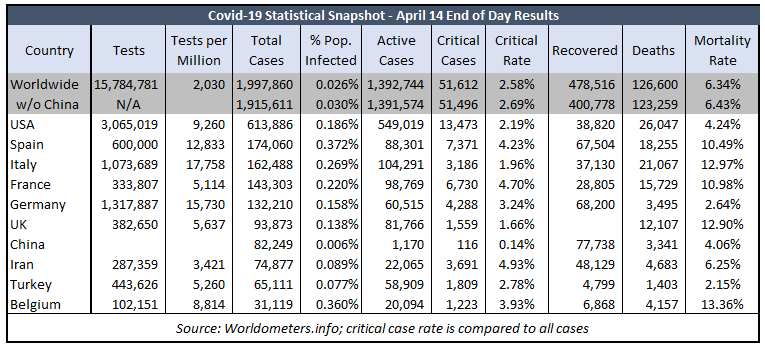
Update April 15 at 8:30 am: Final results for April 14
- Kansas has 489 cases per million of population vs. the national average of 1,849.
- Kansas has 24 deaths per million of population vs. the national average of 79.
- Missouri has 768 cases per million and 23 deaths per million.
- The national mortality rate is 4.24% and the world rate is 6.34%.
Update April 14 at 8:30 am: Final results for April 13
- Kansas has 472 cases per million of population vs. the national average of 1,768.
- Kansas has 21 deaths per million of population vs. the national average of 72.
- Missouri has 735 cases per million and 20 deaths per million.
- The national mortality rate is 4.03% and the world rate is 6.22%.


__________________________________________________________________
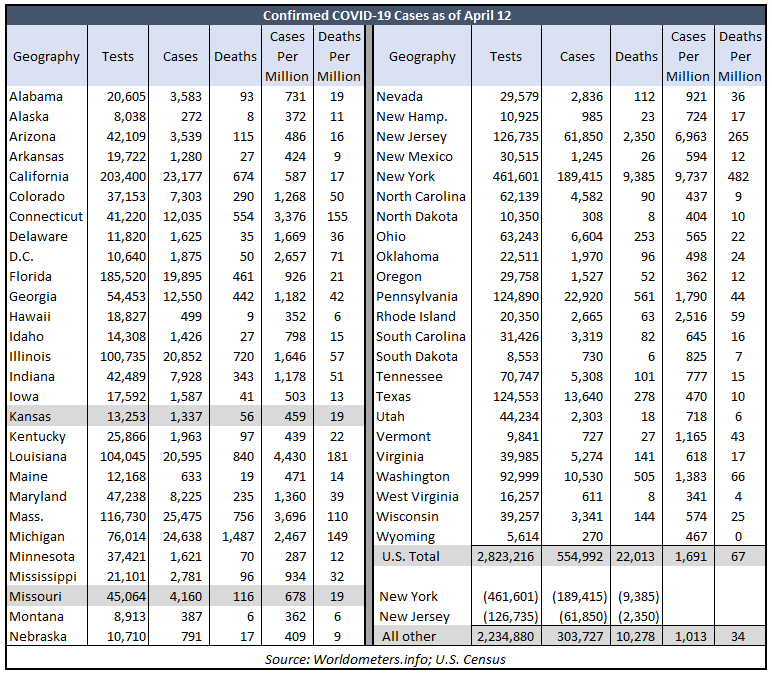
Update April 13 at 9:45 am: Final results for April 12
- Kansas has 459 cases per million of population vs. the national average of 1,691.
- Kansas has 19 deaths per million of population vs. the national average of 67.
- Missouri has 678 cases per million and 19 deaths per million.
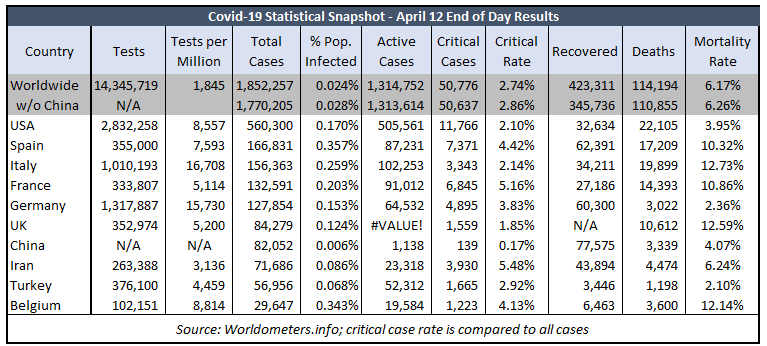
- The national mortality rate is 3.95% and the world rate is 6.17%.
__________________________________________________________________
Update April 12 at 8:00 am: Final results for April 11
- Kansas has 435 cases per million of population vs. the national average of 1,608.
- Kansas has 19 deaths per million of population vs. the national average of 62.
- Missouri has 656 cases per million and 19 deaths per million.
- The national mortality rate is 3.86% and the world rate is 6.11%.


__________________________________________________________________
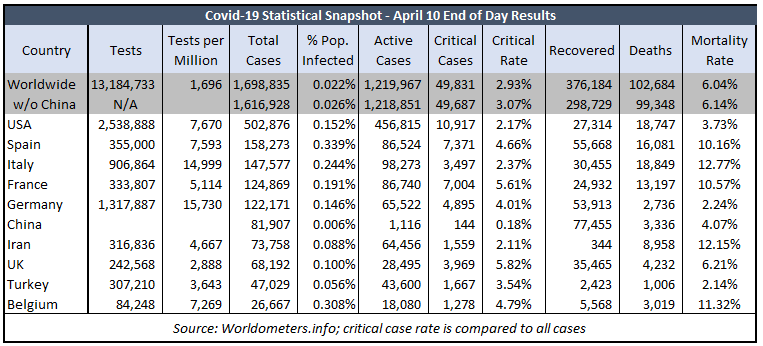
Update April 11 at 10:00 am: Final results for April 10
- Kansas has 400 cases per million of population vs. the national average of 1,517.
- Kansas has 17 deaths per million of population vs. the national average of 57.
- Missouri has 619 cases per million and 16 deaths per million.
- The national mortality rate is 3.73% and the world rate is 6.14%.

__________________________________________________________________
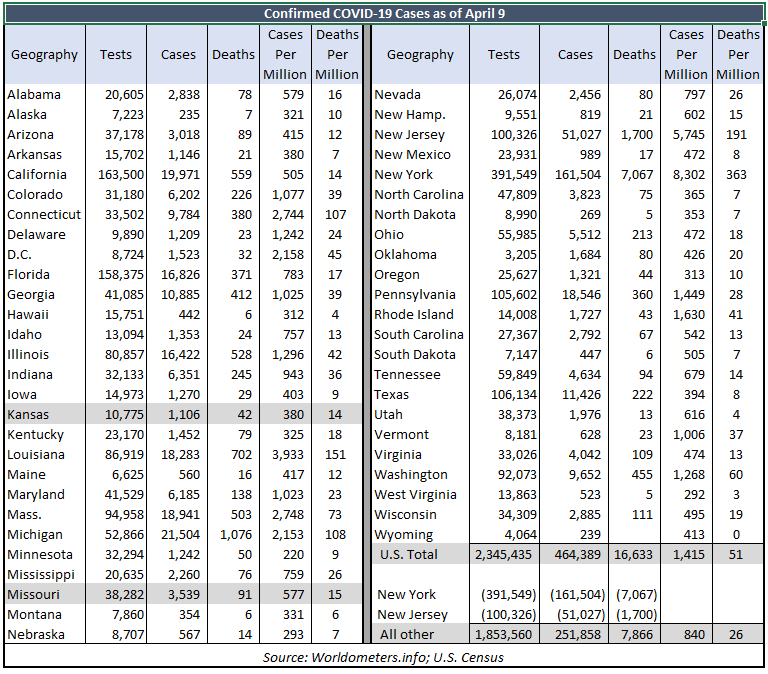
Update April 10 at 10:00 am: Final results for April 9
- Kansas has 380 cases per million of population vs. the national average of 1,415.
- Kansas has 14 deaths per million of population vs. the national average of 51.
- Missouri has 577 cases per million and 15 deaths per million.
- The national mortality rate is 3.56% and the world rate is 5.97%.

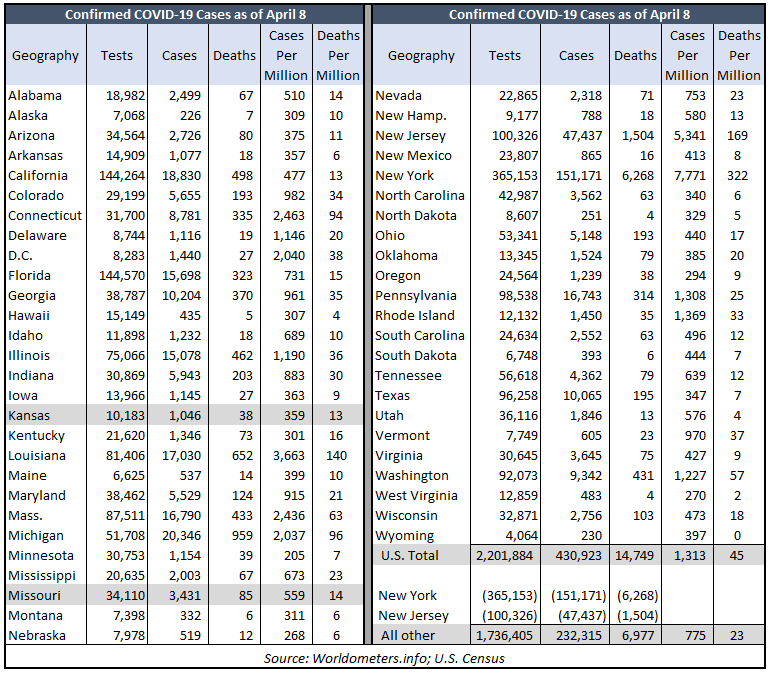
Update April 9 at 9:15 am: Final results for April 8
- Kansas has 359 cases per million of population vs. the national average of 1,313.
- Kansas has 13 deaths per million of population vs. the national average of 45.
- Missouri has 559 cases per million and 14 deaths per million.
- The national mortality rate is 3.4% and the world rate is 5.93%.

__________________________________________________________________
Update April 8 at 9:00 am: Final results for April 7
- Kansas has 330 cases per million of population vs. the national average of 1,217.
- Kansas has 11 deaths per million of population vs. the national average of 39.
- Missouri has 495 cases per million and 11 deaths per million.
- The national mortality rate is 3.21% and the world rate is 5.55%.


___________________________________________________________________
Update April 7 at 11:30 am: Final results for April 6
- Kansas has 290 cases per million of population vs. the national average of 1,116.
- Kansas has 9 deaths per million of population vs. the national average of 33.
- Missouri has 444 cases per million and 8 deaths per million.
- The national mortality rate is 2.96% and the world rate is 5.55%.


___________________________________________________________________
Update April 6 at 11:30 am: Final results for April 5
Worldometers is now reporting testing information for states and nations, so we’ve updated tables accordingly. Also, beginning today, we’re showing data for all 50 states and the District of Columbia.
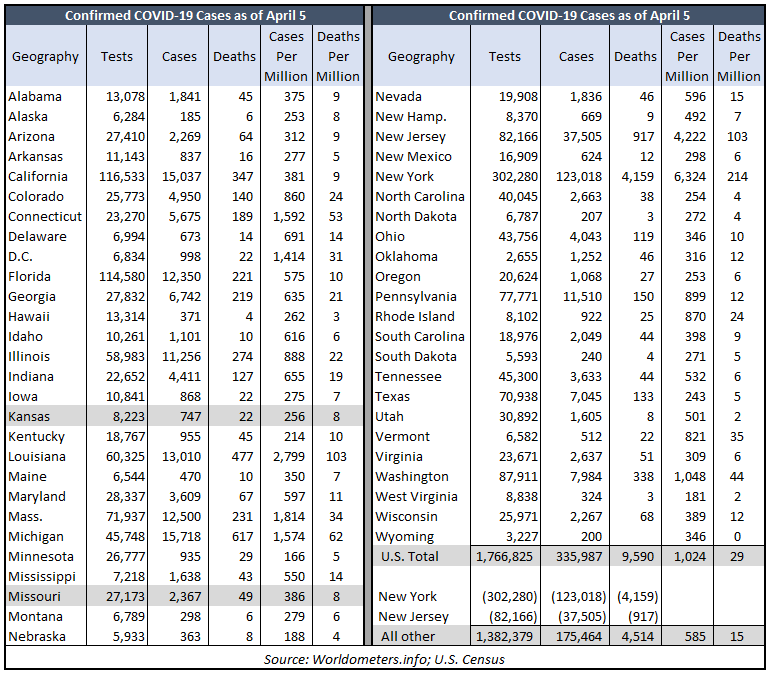
Worldometers includes U.S. territories in the nation’s totals, so there are minor differences between the state listing above and the national totals below.
___________________________________________________________________
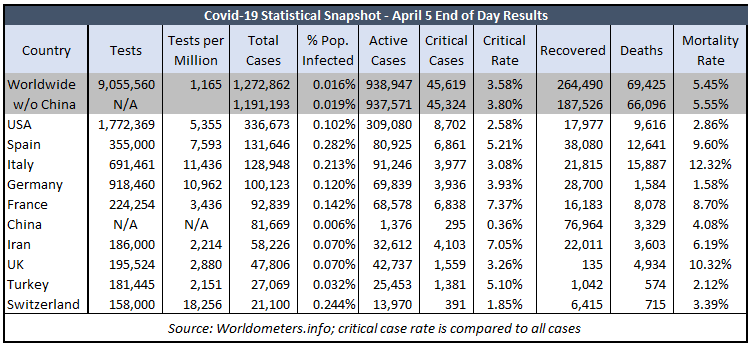
Update April 5 at 9:15 am: Final results for April 4
- The U.S. mortality rate is 2.71%.
- The Kansas mortality rate is 3.01%.
- Worldwide (excluding China) the mortality rate is 5.48%.
- 2.6%% of confirmed cases in the U.S. are classified as serious or critical.
- Confirmed cases account for 94-1,000th of a percent of the U.S. population.
- Confirmed cases account for 24-1,000th of a percent of the Kansas population.

___________________________________________________________________
Update April 4 at 10:00 am: Final results for April 3
- The U.S. mortality rate is 2.67%.
- The Kansas mortality rate is 2.74%.
- Worldwide (excluding China) the mortality rate is 5.39%.
- A little over 2% of confirmed cases in the U.S. are classified as serious or critical.
- Confirmed cases account for 84-1,000th of a percent of the U.S. population.
- Confirmed cases account for 21-1,000th of a percent of the Kansas population.

___________________________________________________________________
Update April 3 at 09:15 am: Final results for April 2
- The U.S. mortality rate is 2.48%.
- The Kansas mortality rate is lower, at 2.36%.
- Worldwide (excluding China) the mortality rate is 5.34%.
- A little over 2% of confirmed cases in the U.S. are classified as serious or critical.
- Confirmed cases account for 74-1,000th of a percent of the U.S. population.
- Confirmed cases account for 19-1,000th of a percent of the Kansas population.

___________________________________________________________________
Update April 2 at 08:45 am: Final results for April 1
- The U.S. mortality rate through April 1 is 2.37%.
- The Kansas mortality rate is lower, at 2.07%.
- Worldwide (excluding China) the mortality rate is 5.14%.
- A little over 2% of confirmed cases in the U.S. are classified as serious or critical.
- Confirmed cases account for 65-1,000th of a percent of the U.S. population.
- Confirmed cases account for 17-1,000th of a percent of the Kansas population.

___________________________________________________________________
Update April 1 at 08:45 am: Final results for March 31
- The U.S. mortality rate through March 31 is 2.15%.
- Worldwide (excluding China) the mortality rate is 4.93%.
- A little over 2% of confirmed cases in the U.S. are classified as serious or critical.
- Confirmed cases account for 57-1,000th of a percent of the U.S. population.

___________________________________________________________________
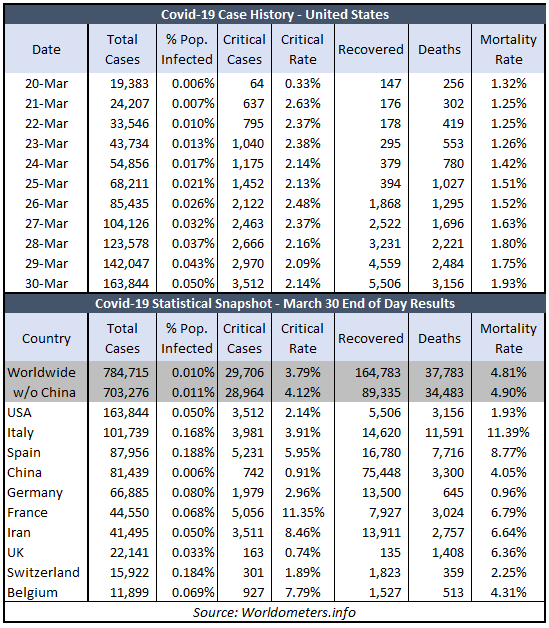
Update March 31 at 08:45 am: Final results for March 30
- The U.S. mortality rate through March 30 is 1.93%.
- Worldwide (excluding China) the mortality rate is 4.9%.
- A little over 2% of confirmed cases in the U.S. are classified as serious or critical.
- Confirmed cases reported account for 50-1,000th of a percent of the U.S. population.
___________________________________________________________________
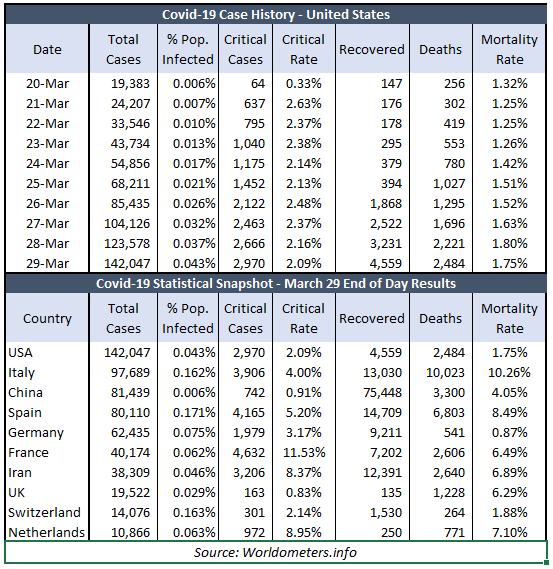
Update March 30 at 09:30 am: Final results for March 29
- The U.S. mortality rate through March 29 was 1.75%.
- A little over 2% of confirmed cases in the U.S. are classified as serious or critical.
- Confirmed cases reported account for 43-1,000th of a percent of the U.S. population.
___________________________________________________________________
Update March 29 at 10:00 am: Final results for March 28
- The U.S. mortality rate through March 28 was 1.8%.
- A little over 2% of confirmed cases in the U.S. are classified as serious or critical.
- Confirmed cases reported account for 37-1,000th of a percent of the U.S. population.

___________________________________________________________________
Update March 28 at 10:25 am: Final results for March 27
- The U.S. mortality rate through March 27 was 1.63%.
- A little over 2% of confirmed cases in the U.S. are classified as serious or critical.
- Confirmed cases reported account for 32-1,000th of a percent of the U.S. population.

_____________________________________________________________________
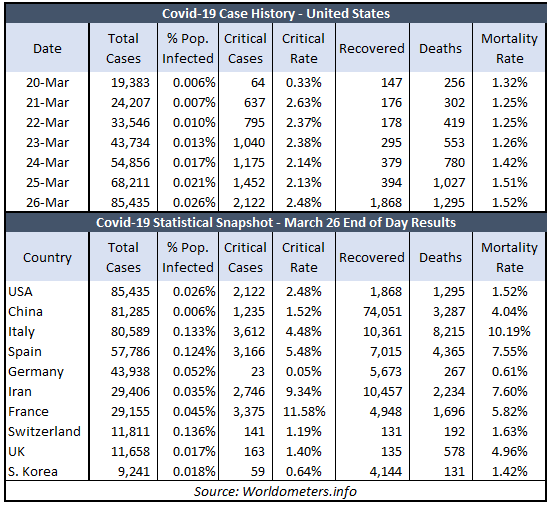
Update March 27 at 10:20 am: Final results for March 26
- The U.S. mortality rate through March 26 was 1.52%.
- A little over 2% of confirmed cases in the U.S. are classified as serious or critical.
- Confirmed cases reported account for 26-1,000th of a percent of the U.S. population.
_____________________________________________________________________
Update March 26 at 9:20 am: Final results for March 25
- The U.S. mortality rate through March 25 was 1.51%.
- A little over 2% of confirmed cases in the U.S. are classified as serious or critical.
- Confirmed cases reported account for 21-1,000th of a percent of the U.S. population.

_____________________________________________________________________
Update March 25 at 9:25 am: Final results for March 24
- The U.S. mortality rate through March 24 was 1.42%.
- A little over 2% of confirmed cases in the U.S. are classified as serious or critical.
- Confirmed cases reported account for 17-1,000th of a percent of the U.S. population.

________________________________________________________________________
Update March 24 at 9:45 am: Final results for March 23
- The U.S. mortality rate through March 23 was 1.26%.
- A little over 2% of confirmed cases in the U.S. are classified as serious or critical.
- Confirmed cases reported account for 13-1,000th of a percent of the U.S. population.

________________________________________________________________________
Here’s the latest coronavirus data from Worldometers.info as of 11:30 am on March 23.
The first section of the table below shows the final results for the United States for March 20 through March 22 and through 11:30 am for March 23. The second section of the table lists the 10 countries with the most confirmed cases reported as of March 22.
- The U.S. mortality rate through March 22 was 1.25%.
- A little over 2% of confirmed cases in the U.S. are classified as serious or critical.
- Confirmed cases reported through this morning account for 12-1,000th of a percent of the U.S. population.
Keep in mind, this data is just based on confirmed cases to date; expanded testing will identify more cases and the rates on critical cases and mortality could rise.

Italy has the highest mortality rate so far – 9.26% – but an article in The Telegraph from the United Kingdom suggests the rate may be driven by other factors. In addition to Italy having a much older population with more underlying health conditions. The article also says Italy has a high rate of smoking and pollution, and the majority of deaths have been in the northern region Lombardy region, which is notorious for poor air quality.
The way Italy records deaths may also be a factor. The Telegraph quotes Professor Walter Ricciardi, scientific adviser to Italy’s minister of health, who says, “The way in which we code deaths in our country is very generous in the sense that all the people who die in hospitals with the coronavirus are deemed to be dying of the coronavirus.
“On re-evaluation by the National Institute of Health, only 12% of death certificates have shown a direct causality from coronavirus, while 88% of patients who have died have at least one pre-morbidity – many had two or three,” he says.