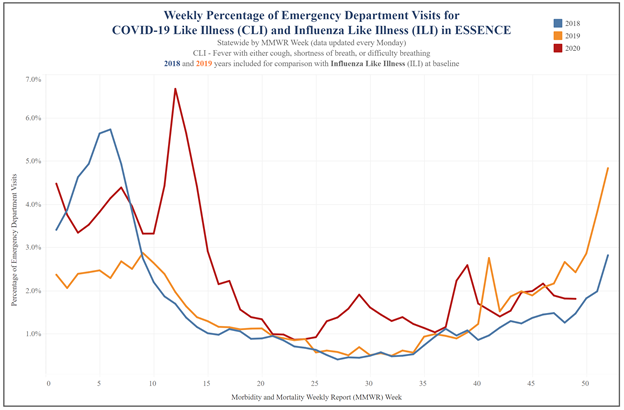
Data tracked by the Kansas Department of Health and Environment show that ED visits (emergency department) for COVID-like and influenza-like illnesses are dropping below 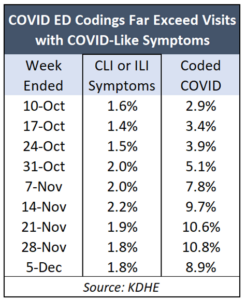 2019 levels. The last three weeks (ended Nov. 21, Nov. 28, and Dec. 5) were below 2019 levels and six of the last nine weeks were lower.
Most recently, only 1.8% of ED visits in Kansas were for treatment of COVID-like illness (CLI) or influenza-like illness (ILI) compared to 2.4% the comparable week in 2019. ED visits for CLI and ILI were 1.8% of total visits for the weeks ended Nov. 21 and Nov. 28, down from 2.2% and 2.7%, respectively, for the previous year.
The weeks ended Oct. 10, Oct. `17, and Oct. 24 were also lower than 2019; ED visits were the same (2%) for the week ended Oct. 31 and visits were one-tenth of a percent higher than last year for the weeks ended Nov. 7 and Nov. 14.
As shown on the KDHE chart below, the share of ED visits for CLI and ILI rose noticeably toward the end of last year, going from 1.5% in mid-October to 4.8% at the end of the year. This year, the trend since mid-November is declining.
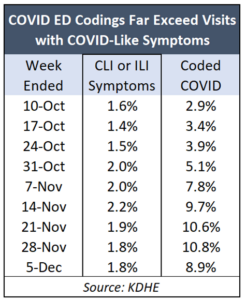
KDHE also has a chart on their site tracking the percentage of ED visits that are coded as COVID, and those numbers are much higher than the visits with symptoms. Comparing the two charts, however, raises questions about reported increases in COVID cases.
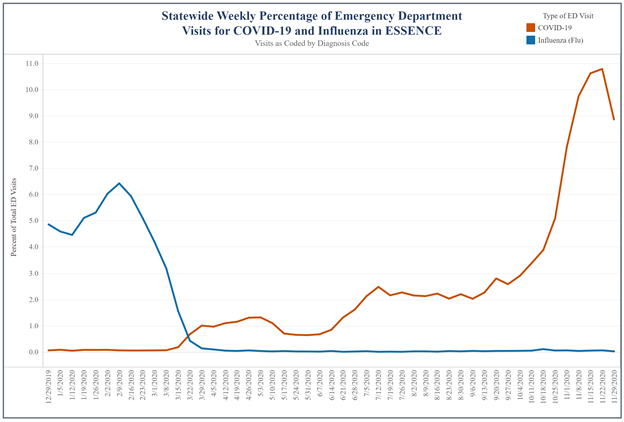
The percentage of visits coded as COVID had been hovering just above 2% from early July through mid-September and then moved closer to 3% by early October.
But then – perhaps coincidentally, but right around the beginning of flu season – the share of ED visits coded as COVID ramped up and by November, was more than three times the share of visits with reported symptoms. The peak was the week ended November 28, when 1.8% of visits reported CLI or ILI symptoms but 10.8% were coded as COVID.
 Now, look at the chart tracking symptoms. In 2019, the share of visits with flu-like symptoms began rising in late September and climbed steadily through the end of the year, going from 1.5% in mid-October to 4.8% by the end of the year. The chart tracking visit coding shows between 5% and 6% of visits in January and February this year were coded as influenza, which tracks with the chart of symptoms over the same time period. This fall, however, less than half of 1% are being coded as influenza.
But at the same time, more than three times as many people presenting with CLI or ILI symptoms are being coded as COVID.
The Sentinel asked if all ED visits coded as COVID result from positive COVID tests, and the answer may partially explain the discrepancy.
KDHE epidemiologist Justin Blanding told the Sentinel that some ED visits coded as COVID could be the result of positive tests but some may be just the diagnosis of the attending physician with no COVID test conducted.
COVID survival holds steady at 98.9%
Despite steadily rising case numbers, the survival rate has been holding steady at around 98.9%.
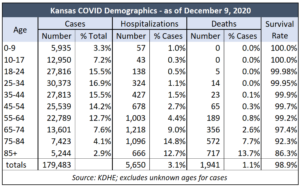 The survival rate for kids ages 0-17 remains at 100% and it’s 99.8% for adults 18-64 as of December 9. The rate is 97.4% for adults 65-74 and 92.3% for adults 75-84.
Adults 85 and over have been the most impacted, with an 86.3% survival rate. That group comprises only 2.9% of all reported cases but accounts for 37% of all deaths attributed to COVID.
Most counties don’t publish hospitalizations and deaths by age group but breakouts for Johnson and Wyandotte counties are in the COVID Information Center published by the Sentinel’s parent company, Kansas Policy institute.
Other reports in the COVID Information Center include deaths, cases, and survival rates by county and state, case clusters in Kansas, hospital and ICU utilization, and COVID deaths compared to pneumonia and influenza for Kansas and neighboring states.


